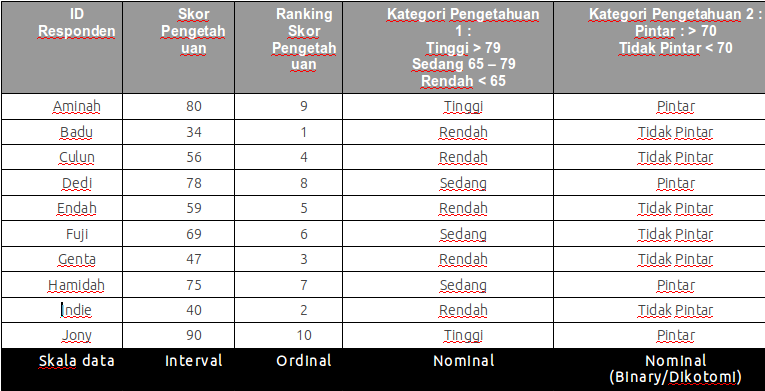
The human mind, in its endless quest for understanding, seeks to quantify the world around us. We measure distance, weight, time, and even more abstract concepts like emotions and opinions. But not all measurements are created equal. Some merely categorize, while others reveal the very magnitude of differences. It's within this realm of quantifying differences that we encounter interval scales – a fascinating concept with profound implications for research, statistics, and our understanding of data.
Imagine a world where we could only describe temperature as "hot" or "cold." While these terms provide a basic sense of temperature differences, they lack the precision needed for scientific analysis, weather forecasting, or even everyday conversations. Enter the Celsius scale – a prime example of an interval scale. It not only tells us if it's hot or cold but also quantifies the degree of hotness or coldness, allowing us to make meaningful comparisons and draw insightful conclusions.
Interval scales, as their name suggests, deal with intervals – the spaces between data points. Unlike nominal scales, which simply categorize data (like colors or countries), or ordinal scales, which rank data in order (like finishing positions in a race), interval scales go a step further. They maintain equal intervals between data points, making it possible to perform mathematical operations like addition and subtraction. This unique property opens up a world of possibilities for data analysis and interpretation.
The impact of interval scales extends far beyond scientific laboratories and research papers. From measuring temperature to gauging time, from assessing attitudes in surveys to tracking financial market fluctuations, these scales underpin countless aspects of our lives. They empower us to make sense of complex data, uncover hidden patterns, and make informed decisions.
However, the power of interval scales comes with certain limitations. One crucial aspect is the absence of a true zero point. Consider the Celsius scale once more. While 0°C marks the freezing point of water, it doesn't signify an absolute absence of heat. This inherent characteristic of interval scales has implications for data interpretation, particularly when it comes to calculating ratios. For instance, we cannot say that 20°C is "twice as hot" as 10°C, as the ratio doesn't hold true in an absolute sense.
Advantages and Disadvantages of Interval Scales
| Advantages | Disadvantages |
|---|---|
| Allows for quantifying differences between data points. | Lacks a true zero point, limiting ratio calculations. |
| Enables mathematical operations like addition and subtraction. | Data interpretation can be subjective without a fixed reference point. |
| Suitable for various statistical analyses. | Susceptible to outliers that can skew data distribution. |
Despite these limitations, interval scales remain an indispensable tool in our quest to understand and interpret the world. By grasping their principles and recognizing both their strengths and limitations, we can harness their power to extract valuable insights from data and make more informed decisions in our personal and professional lives.
Unlocking potential comprehensive language textbooks
Ice spice and onlyfans separating fact from fiction
Escape to paradise unwind at the one resort koh rong samloem
contoh dari skala interval - Khao Tick On
contoh dari skala interval - Khao Tick On
contoh dari skala interval - Khao Tick On
contoh dari skala interval - Khao Tick On
contoh dari skala interval - Khao Tick On
contoh dari skala interval - Khao Tick On
contoh dari skala interval - Khao Tick On
contoh dari skala interval - Khao Tick On
contoh dari skala interval - Khao Tick On
contoh dari skala interval - Khao Tick On
contoh dari skala interval - Khao Tick On
contoh dari skala interval - Khao Tick On
contoh dari skala interval - Khao Tick On
contoh dari skala interval - Khao Tick On
contoh dari skala interval - Khao Tick On


